Distributed Tracing: OpenTelemetry, Jaeger, Zipkin
Master distributed tracing with OpenTelemetry, Jaeger, and Zipkin. Trace propagation across services, span context, sampling strategies, and production debugging.
Introduction
A request in a microservices system touches a gateway, an auth service, a couple of backends, a database, maybe a queue — and when it’s slow, nobody knows where the time went. Logs tell you what each service did; distributed tracing tells you where the request actually spent its milliseconds.
This guide builds a production tracing setup end to end: instrumenting services with OpenTelemetry in Python, Node and Java, propagating context across HTTP and Kafka, choosing a sampling strategy that fits your traffic, running the OTel Collector in front of Jaeger or Zipkin, and reading traces to find real bugs. Every example is runnable — the only thing you’ll adapt is the exporter endpoint.
If you want the conceptual walkthrough first, the Distributed Tracing guide covers the “what is a trace” angle; this one goes straight to implementation. For OpenTelemetry metrics and logs beyond tracing, see the OpenTelemetry guide.
Core Concepts
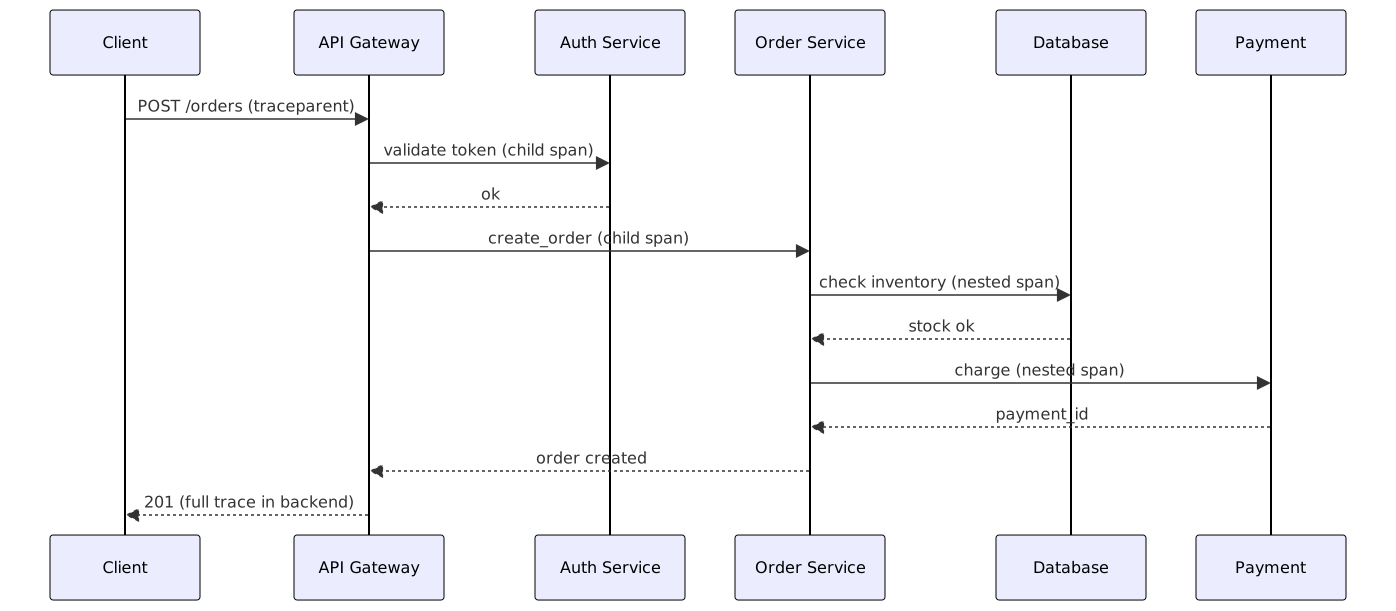
Three terms carry everything else. A trace is the complete journey of one request — the unit you see as a waterfall in Jaeger. A span is a single unit of work inside it (one service call, one DB query), with a trace_id, a span_id, a parent_span_id, timing, attributes (key-value metadata) and events (timestamped log lines inside the span). Context is the trace_id + span_id pair that travels across service boundaries so every service can attach its spans to the same trace.
Trace: the entire journey of a single request across all services
  ├── Span A (Service: API Gateway)         [0ms - 150ms]
  │   ├── Span B (Service: Auth Service)    [5ms - 20ms]
  │   ├── Span C (Service: Order Service)   [20ms - 140ms]
  │   │   ├── Span D (Service: Database)    [25ms - 50ms]
  │   │   ├── Span E (Service: Inventory)   [55ms - 90ms]
  │   │   └── Span F (Service: Payment)     [95ms - 135ms]
  │   └── Span G (Service: Response)        [140ms - 150ms]

Span: a single unit of work (one service call, one DB query)
  - Has a trace_id, span_id, parent_span_id
  - Has start time, duration, and status
  - Has attributes (key-value metadata)
  - Has events (timestamped logs within the span)

Context: the trace_id and span_id propagated across service boundaries
  - Passed via HTTP headers, gRPC metadata, or message headers
  - W3C Trace Context is the standard format
Two details worth memorizing. Attributes are indexed and cheap to query in the backend; events are just timestamps inside a span and aren’t queryable — put IDs in attributes, narratives in events. And there’s a third propagated thing besides context: baggage, arbitrary key-value pairs (like tenant.id) that travel with the trace to every downstream service. Use it sparingly — it inflates every header.
OpenTelemetry Instrumentation
Auto-instrumentation patches the libraries you already use — Flask, Express, Spring, HTTP clients, database drivers — and produces spans without touching business code. It covers the plumbing. What it can’t see is your domain logic: “create_order” and “charge_customer” are your words, so those spans you write yourself. Real services use both: auto for the edges, manual spans for the business steps in between.
Python: auto-instrumentation
# instrumentation.py — OpenTelemetry auto-instrumentation for Python
from opentelemetry import trace
from opentelemetry.sdk.trace import TracerProvider
from opentelemetry.sdk.trace.export import BatchSpanProcessor
from opentelemetry.exporter.otlp.proto.grpc.trace_exporter import OTLPSpanExporter
from opentelemetry.sdk.resources import Resource

# Configure the tracer
resource = Resource.create({
    "service.name": "order-service",
    "service.version": "1.0.0",
    "deployment.environment": "production",
})

provider = TracerProvider(resource=resource)
processor = BatchSpanProcessor(
    OTLPSpanExporter(endpoint="http://otel-collector:4317")
)
provider.add_span_processor(processor)
trace.set_tracer_provider(provider)

# Auto-instrumentation for common libraries
from opentelemetry.instrumentation.flask import FlaskInstrumentor
from opentelemetry.instrumentation.requests import RequestsInstrumentor
from opentelemetry.instrumentation.sqlalchemy import SQLAlchemyInstrumentor
from opentelemetry.instrumentation.redis import RedisInstrumentor

FlaskInstrumentor().instrument_app(app)
RequestsInstrumentor().instrument()
SQLAlchemyInstrumentor().instrument(engine=db.engine)
RedisInstrumentor().instrument()
Two things in this block pay off every day: the Resource (this is what shows up as the service name in Jaeger — forget it and your spans land as unknown_service) and BatchSpanProcessor, which buffers spans and exports them in batches instead of one network call per span. Never use the synchronous SimpleSpanProcessor in production.
Python: manual spans
# order_service.py — Manual span creation
from opentelemetry import trace
from opentelemetry.trace import Status, StatusCode

tracer = trace.get_tracer(__name__)

class OrderService:
    def create_order(self, user_id: int, items: list[dict]) -> dict:
        with tracer.start_as_current_span("create_order") as span:
            span.set_attribute("user.id", user_id)
            span.set_attribute("items.count", len(items))

            try:
                # Validate user
                with tracer.start_as_current_span("validate_user") as child:
                    user = self.auth_client.get_user(user_id)
                    child.set_attribute("user.email", user["email"])
                    child.set_attribute("user.active", user["is_active"])

                # Check inventory
                with tracer.start_as_current_span("check_inventory") as child:
                    for item in items:
                        stock = self.inventory_client.get_stock(item["product_id"])
                        child.set_attribute(f"product.{item['product_id']}.stock", stock)
                        if stock < item["quantity"]:
                            raise ValueError(f"Insufficient stock for product {item['product_id']}")

                # Process payment
                with tracer.start_as_current_span("process_payment") as child:
                    payment = self.payment_client.charge(
                        user_id=user_id,
                        amount=sum(i["price"] * i["quantity"] for i in items),
                    )
                    child.set_attribute("payment.id", payment["id"])
                    child.set_attribute("payment.amount", payment["amount"])

                # Save order
                with tracer.start_as_current_span("save_order") as child:
                    order = self.order_repo.create(user_id=user_id, items=items, payment_id=payment["id"])
                    child.set_attribute("order.id", order["id"])

                span.set_attribute("order.id", order["id"])
                span.set_status(Status(StatusCode.OK))
                return order

            except Exception as e:
                span.record_exception(e)
                span.set_status(Status(StatusCode.ERROR, str(e)))
                raise
Note the pattern: nested start_as_current_span blocks create the parent-child tree automatically, and the except path both records the exception and marks the span ERROR — that error status is what lets tail sampling and Jaeger’s error filter find it later.
TypeScript: Node.js instrumentation
// tracing.ts — OpenTelemetry for Node.js
import { NodeSDK } from "@opentelemetry/sdk-node";
import { OTLPTraceExporter } from "@opentelemetry/exporter-trace-otlp-grpc";
import { Resource } from "@opentelemetry/resources";
import { ATTR_SERVICE_NAME, ATTR_SERVICE_VERSION } from "@opentelemetry/semantic-conventions";
import { ExpressInstrumentation } from "@opentelemetry/instrumentation-express";
import { HttpInstrumentation } from "@opentelemetry/instrumentation-http";
import { PgInstrumentation } from "@opentelemetry/instrumentation-pg";
import { RedisInstrumentation } from "@opentelemetry/instrumentation-redis-4";
import { trace, context, SpanStatusCode } from "@opentelemetry/api";

const sdk = new NodeSDK({
  resource: new Resource({
    [ATTR_SERVICE_NAME]: "api-gateway",
    [ATTR_SERVICE_VERSION]: "1.0.0",
  }),
  traceExporter: new OTLPTraceExporter({
    url: "http://otel-collector:4317",
  }),
  instrumentations: [
    new HttpInstrumentation(),
    new ExpressInstrumentation(),
    new PgInstrumentation(),
    new RedisInstrumentation(),
  ],
});

sdk.start();

// Manual spans
const tracer = trace.getTracer("api-gateway");

async function handleRequest(req: Request, res: Response) {
  const span = tracer.startSpan("handle_request", {
    attributes: {
      "http.method": req.method,
      "http.url": req.url,
      "user.id": req.userId,
    },
  });

  try {
    await context.with(trace.setSpan(context.active(), span), async () => {
      const authResult = await validateToken(req.headers.authorization);
      const userData = await fetchUserData(req.userId);
      const processedData = await processData(userData);

      span.setAttribute("response.size", JSON.stringify(processedData).length);
      span.setStatus({ code: SpanStatusCode.OK });
      res.json(processedData);
    });
  } catch (error) {
    span.recordException(error);
    span.setStatus({ code: SpanStatusCode.ERROR, message: error.message });
    res.status(500).json({ error: "Internal server error" });
  } finally {
    span.end();
  }
}
The Node API splits span creation (tracer.startSpan) from activation: context.with(trace.setSpan(context.active(), span), fn) makes the span current for everything inside fn, which is what lets downstream auto-instrumentation attach its spans as children. Ending the span in finally isn’t optional — unended spans leak.
Java: Spring Boot instrumentation
// TracingConfig.java — OpenTelemetry for Spring Boot
import io.opentelemetry.api.OpenTelemetry;
import io.opentelemetry.api.GlobalOpenTelemetry;
import io.opentelemetry.api.common.Attributes;
import io.opentelemetry.sdk.OpenTelemetrySdk;
import io.opentelemetry.sdk.trace.SdkTracerProvider;
import io.opentelemetry.sdk.trace.export.BatchSpanProcessor;
import io.opentelemetry.exporter.otlp.trace.OtlpGrpcSpanExporter;
import io.opentelemetry.sdk.resources.Resource;
import io.opentelemetry.semconv.ResourceAttributes;

@Configuration
public class TracingConfig {

    @Bean
    public OpenTelemetry openTelemetry() {
        Resource resource = Resource.getDefault()
            .merge(Resource.create(Attributes.of(
                ResourceAttributes.SERVICE_NAME, "order-service",
                ResourceAttributes.SERVICE_VERSION, "1.0.0",
                ResourceAttributes.DEPLOYMENT_ENVIRONMENT, "production"
            )));

        SdkTracerProvider tracerProvider = SdkTracerProvider.builder()
            .setResource(resource)
            .addSpanProcessor(BatchSpanProcessor.builder(
                OtlpGrpcSpanExporter.builder()
                    .setEndpoint("http://otel-collector:4317")
                    .build()
            ).build())
            .build();

        OpenTelemetrySdk sdk = OpenTelemetrySdk.builder()
            .setTracerProvider(tracerProvider)
            .build();

        GlobalOpenTelemetry.set(sdk);
        return sdk;
    }
}

// Manual spans in service code
@Service
public class OrderService {

    private final Tracer tracer;

    public OrderService(OpenTelemetry openTelemetry) {
        this.tracer = openTelemetry.getTracer("order-service");
    }

    public Order createOrder(Long userId, List<OrderItem> items) {
        Span span = tracer.spanBuilder("create_order")
            .setAttribute("user.id", userId)
            .setAttribute("items.count", items.size())
            .startSpan();

        try (Scope scope = span.makeCurrent()) {
            User user = authService.validateUser(userId);
            Span validateSpan = tracer.spanBuilder("validate_user")
                .setAttribute("user.email", user.getEmail())
                .startSpan();
            validateSpan.end();

            Payment payment = paymentService.charge(userId, calculateTotal(items));
            Order order = orderRepository.save(new Order(userId, items, payment.getId()));

            span.setAttribute("order.id", order.getId());
            span.setStatus(StatusCode.OK);
            return order;
        } catch (Exception e) {
            span.recordException(e);
            span.setStatus(StatusCode.ERROR, e.getMessage());
            throw e;
        } finally {
            span.end();
        }
    }
}
In practice you won’t write most of this by hand: the OpenTelemetry Java agent (-javaagent:opentelemetry-javaagent.jar) auto-instruments Spring, JDBC and HTTP clients with zero code. The manual Span API above is for the business operations the agent can’t name for you — same split as Python and Node.
Trace Propagation
A trace is only a trace if the context survives every hop. The propagation format everyone speaks is W3C Trace Context: a traceparent header carrying 00-{32-hex trace id}-{16-hex span id}-{flags}, plus an optional tracestate for vendor data. OTel propagators handle both directions — inject writes the current context into outgoing headers, extract reads it on the receiving side.
HTTP propagation
# W3C Trace Context format
# traceparent: 00-{trace-id}-{parent-span-id}-{trace-flags}
# Example: 00-0af7651916cd43dd8448eb211c80319c-b7ad6b7169203331-01

# Python: Propagate context across HTTP calls
import requests
from opentelemetry import trace, propagate

def call_downstream_service(url: str, data: dict) -> dict:
    headers = {"Content-Type": "application/json"}

    # Inject trace context into headers
    current_span = trace.get_current_span()
    propagate.inject(headers)

    response = requests.post(url, json=data, headers=headers)
    return response.json()
// TypeScript: Propagate context across fetch calls
import { propagation, context } from "@opentelemetry/api";
import { W3CTraceContextPropagator } from "@opentelemetry/core";
async function callDownstream(url: string, data: any): Promise<any> {
const headers: Record<string, string> = { "Content-Type": "application/json" };
// Inject trace context
propagation.inject(context.active(), headers, {
set: (carrier, key, value) => { carrier[key] = value; },
});
const response = await fetch(url, {
method: "POST",
headers,
body: JSON.stringify(data),
});
return response.json();
}If you’re auto-instrumented, HTTP propagation is already handled — requests, fetch and RestTemplate get the traceparent header for free. You inject manually for custom clients, non-HTTP transports, or when the instrumentation misses a library.
Message queue propagation
Queues are where traces most often die. HTTP headers propagate automatically; Kafka message headers don’t — the producer must inject context into the message headers, and the consumer must extract it and start its span as a child of the producer’s:
# Kafka: Propagate trace context through message headers
from kafka import KafkaProducer, KafkaConsumer
from opentelemetry import trace, propagate

producer = KafkaProducer(bootstrap_servers=["localhost:9092"])

def send_event(topic: str, event: dict):
    headers = {}
    propagate.inject(headers)

    kafka_headers = [(k, v.encode("utf-8")) for k, v in headers.items()]
    producer.send(topic, value=json.dumps(event).encode("utf-8"), headers=kafka_headers)
    producer.flush()

consumer = KafkaConsumer("orders", bootstrap_servers=["localhost:9092"])

def consume_events():
    for message in consumer:
        # Extract trace context from message headers
        headers = {k: v.decode("utf-8") for k, v in message.headers}
        ctx = propagate.extract(headers)

        with tracer.start_as_current_span("process_event", context=ctx):
            event = json.loads(message.value)
            process_order_event(event)
One structural caveat: batch consumers that process many messages per span create ugly “fan-in” traces. If each message deserves its own trace, use span links (Span.fromContext + links=[...]) to associate without parenting — the backend UI shows them as related rather than nested.
Sampling Strategies
Unsampled tracing at volume is expensive: every service exports every request, and the backend stores all of it. At a few thousand requests per minute the storage and egress bills start to matter, which is why sampling exists — keep a fraction of traces and still see the shape of the system.
Head-based sampling (probabilistic)
# Always sample a percentage of traces at the entry point
from opentelemetry.sdk.trace.sampling import TraceIdRatioBased, ALWAYS_ON

# Sample 10% of traces
sampler = TraceIdRatioBased(0.1)

# Or always sample (for development)
sampler = ALWAYS_ON

provider = TracerProvider(resource=resource, sampler=sampler)
Head sampling decides when the trace starts, before anything has happened. It’s cheap — the decision is one hash of the trace ID — but blind: a 10% sampler keeps 10% of your errors, because nobody knows yet that the request will fail.
Tail-based sampling (conditional)
Tail sampling decides after the trace finishes, in the collector, with full knowledge of every span. That’s what lets you say “keep every error and every trace slower than 2 seconds, plus 10% of the rest”:
# otel-collector-config.yaml — Tail-based sampling in collector
receivers:
  otlp:
    protocols:
      grpc:
        endpoint: 0.0.0.0:4317

processors:
  tail_sampling:
    decision_wait: 10s
    num_traces: 100000
    policies:
      # Sample all errors
      - name: errors
        type: status_code
        status_code:
          status_codes: [ERROR]

      # Sample slow traces (>2s)
      - name: slow
        type: latency
        latency:
          threshold_ms: 2000

      # Sample 10% of everything else
      - name: baseline
        type: probabilistic
        probabilistic:
          sampling_percentage: 10

exporters:
  jaeger:
    endpoint: jaeger:14250
    tls:
      insecure: true

service:
  pipelines:
    traces:
      receivers: [otlp]
      processors: [tail_sampling]
      exporters: [jaeger]
The trade-off is memory: decision_wait defines how long the collector buffers spans while it waits for stragglers, and num_traces caps the trace pool it keeps in RAM. Production rule of thumb — head sampling for dev and low-volume services, tail sampling once you’re doing enough traffic that “keep all errors” actually saves storage.
Jaeger and Zipkin Backends
The backend stores spans and renders the waterfall. Jaeger is the heavyweight: Elasticsearch or Cassandra storage, per-service graphs, built for scale. Zipkin is the lightweight original: single binary, memory or MySQL/Elasticsearch storage, fine for small deployments. A third option worth knowing is Grafana Tempo — object storage instead of Elasticsearch, much cheaper at volume, and it queries with TraceQL. All three accept OTLP, so the instrumentation above doesn’t change.
Jaeger deployment
# docker-compose.yml — Jaeger all-in-one for development
version: "3.8"
services:
  jaeger:
    image: jaegertracing/all-in-one:1.57
    ports:
      - "16686:16686"   # Jaeger UI
      - "14250:14250"   # gRPC
      - "4317:4317"     # OTLP gRPC
      - "4318:4318"     # OTLP HTTP
    environment:
      - COLLECTOR_OTLP_ENABLED=true

  # For production, use Jaeger with Elasticsearch storage
  elasticsearch:
    image: docker.elastic.co/elasticsearch/elasticsearch:8.13.0
    environment:
      - discovery.type=single-node
      - xpack.security.enabled=false
    ports:
      - "9200:9200"
Zipkin deployment
# docker-compose.yml — Zipkin for development
version: "3.8"
services:
  zipkin:
    image: openzipkin/zipkin:3.4
    ports:
      - "9411:9411"   # Zipkin UI and API
    environment:
      - STORAGE_TYPE=mem  # Use elasticsearch for production
Querying traces
Both backends expose their UI’s search as a REST API — the same calls the UI makes when you filter by service, duration or tags:
# Jaeger API: Find traces for a service
curl "http://localhost:16686/api/traces?service=order-service&limit=20"

# Jaeger API: Find traces with errors
curl "http://localhost:16686/api/traces?service=order-service&tags=error%3Dtrue"

# Zipkin API: Find traces by span name
curl "http://localhost:9411/api/v2/traces?spanName=create_order&limit=20"
OTel Collector
Your apps could export straight to Jaeger — but then every service holds backend config, and any change (new endpoint, new sampler, a second backend) means touching all of them. The Collector sits in between: apps always export to otel-collector:4317, and the collector decides what happens next — batching, filtering noise, tail sampling, fanning out to one or more backends. One place to change, zero app redeploys.
# otel-collector-config.yaml — Production collector config
receivers:
  otlp:
    protocols:
      grpc:
        endpoint: 0.0.0.0:4317
      http:
        endpoint: 0.0.0.0:4318

processors:
  batch:
    timeout: 5s
    send_batch_size: 1000

  memory_limiter:
    check_interval: 2s
    limit_percentage: 80
    spike_limit_percentage: 25

  resource:
    attributes:
      - key: deployment.environment
        value: production
        action: upsert

  filter:
    traces:
      deny:
        # Drop health check spans
        - attributes["http.route"] == "/health"

exporters:
  jaeger:
    endpoint: jaeger:14250
    tls:
      insecure: true

  zipkin:
    endpoint: http://zipkin:9411/api/v2/spans

  logging:
    loglevel: warn

service:
  pipelines:
    traces:
      receivers: [otlp]
      processors: [memory_limiter, filter, resource, batch]
      exporters: [jaeger]
Processor order matters — memory_limiter goes first so a traffic spike gets shed before the other processors spend memory on it, filter drops health-check noise early, and batch goes last to compress what’s left into efficient exports. The exporters list accepts several backends at once: shipping the same spans to Jaeger and to a managed backend costs you nothing but egress.
Production Debugging Patterns
Instrumentation earns its keep the day production is slow and you don’t know why. These three patterns turn traces from decoration into a debugging tool.
Finding slow requests
# Add custom attributes to identify slow operations
with tracer.start_as_current_span("database_query") as span:
    start = time.time()
    result = db.execute(query)
    elapsed = time.time() - start

    span.set_attribute("db.duration_ms", elapsed * 1000)
    span.set_attribute("db.rows_returned", len(result))

    if elapsed > 1.0:
        span.set_attribute("db.slow_query", True)
        span.add_event("slow_query_detected", {
            "query": query[:200],
            "duration_ms": elapsed * 1000,
        })
The db.slow_query attribute becomes a filterable tag in Jaeger — tags=slow_query:true in the search bar returns exactly the traces where queries dragged, instead of scrolling through waterfalls hoping to spot them.
Tracking errors across services
# Add error details to spans for cross-service debugging
try:
    result = downstream_service.call(payload)
except requests.HTTPError as e:
    span = trace.get_current_span()
    span.record_exception(e)
    span.set_attribute("error.type", "http_error")
    span.set_attribute("error.status_code", e.response.status_code)
    span.set_attribute("error.response_body", e.response.text[:500])
    span.set_status(Status(StatusCode.ERROR, str(e)))
    raise
Recording the exception on the calling span is what reconstructs causality: the downstream service might log a 500, but the trace shows it was your process_payment span that failed because validate_user upstream returned stale data. Keep error.response_body bounded — 500 chars is enough for the signature, a whole response isn’t.
Business context in traces
# Add business-relevant attributes for filtering in Jaeger/Zipkin
with tracer.start_as_current_span("process_checkout") as span:
    span.set_attribute("order.id", order.id)
    span.set_attribute("order.total", order.total)
    span.set_attribute("order.items_count", len(order.items))
    span.set_attribute("user.id", order.user_id)
    span.set_attribute("user.tier", user.tier)  # free, pro, enterprise
    span.set_attribute("payment.method", payment.method)
    span.set_attribute("checkout.flow", "standard")
This is the pattern that pays for tracing by itself: user.tier=enterprise + error in the search bar is “show me every failed request from paying customers” — the exact set your on-call actually cares about.
Best Practices
- Use auto-instrumentation first — covers HTTP, database, and cache calls automatically
- Add manual spans for business logic — auto-instrumentation can’t see your domain logic
- Use semantic conventions — standard attribute names like
http.method,db.system - Set
service.nameandservice.versionin resource attributes — identifies the service in UI - Use tail-based sampling in production — capture all errors and slow traces, sample the rest
- Add business context attributes — filter traces by user ID, order ID, or feature flag
- Keep span attributes small — avoid putting large payloads in span attributes
- Use span events for timed logs within a span — more useful than separate log entries
- Propagate context through message queues — don’t break the trace at async boundaries
- Filter health check spans — they pollute trace data with noise
Common Mistakes
- Not propagating context: downstream service calls don’t carry the trace context, breaking the trace. Always inject/extract context at service boundaries.
- Too many spans: creating a span for every function call creates noise. Span at service boundaries and significant business operations.
- Missing error recording: exceptions are caught but not recorded in the span. Use
span.record_exception(e)and set error status. - Using head-based sampling only: you miss all errors because the sampling decision is made before the error occurs. Use tail-based sampling.
- No resource attributes: spans show up as “unknown_service” in Jaeger. Always set
service.name.
See Also
- Distributed Tracing Guide — the conceptual walkthrough: what traces are and how to read the waterfall.
- OpenTelemetry Guide — OTel beyond tracing: metrics, logs and the SDK in depth.
- Structured Logging Guide — emit
trace_idin logs to correlate them with spans. - Observability with the Grafana Stack — Tempo, Prometheus and Loki as the full backend.
External references:
- OpenTelemetry documentation — SDKs, instrumentations and semantic conventions.
- W3C Trace Context specification — the
traceparent/tracestateheader format. - Jaeger documentation — architecture, storage backends and production deployment.
Frequently Asked Questions
What is distributed tracing?
A method of tracking a single request as it flows through every service it touches. Each service adds a span to the trace, creating a tree of spans that shows the full request path with timing and status information.
What is OpenTelemetry?
A CNCF project providing vendor-neutral APIs, SDKs, and collectors for distributed tracing, metrics, and logs. It replaces proprietary instrumentation from Jaeger, Zipkin, and other tracing systems — instrument once, export anywhere.
Head-based vs. tail-based sampling?
Head-based sampling decides at trace start whether to sample — fast but can't consider errors. Tail-based sampling decides after the trace completes — can sample all errors and slow traces, but requires buffering traces in the collector. Use head for dev and low volume, tail for production.
Jaeger, Zipkin or Tempo?
Jaeger for full-featured deployments with Elasticsearch/Cassandra storage. Zipkin for simple setups with a single binary. Tempo for high volume on a budget — it stores traces in object storage (S3) instead of Elasticsearch, so storage cost drops an order of magnitude. All three accept OTLP; switching backends doesn't touch your instrumentation.
What is a trace context?
The trace ID, span ID, and trace flags propagated across service boundaries. W3C Trace Context is the standard format, passed via traceparent and tracestate HTTP headers.
How do traces connect with logs?
Emit trace_id and span_id in your log records — OpenTelemetry's logging integrations do this automatically — and your log platform can jump from a log line to the full trace. Most backends can also link the other way, from a trace to its correlated logs. See the structured logging guide for the log side of the setup.
How much overhead does tracing add?
With batch span processing and 10% sampling, overhead is typically <1% CPU and <5MB memory per service. The OTel Collector adds minimal latency (<1ms per span). Use memory_limiter processor to prevent OOM.
Related Resources
Distributed Tracing: Request Flow Across Services
A practical guide to distributed tracing: instrumenting applications, trace propagation, sampling strategies, and diagnosing latency in microservice architectures with OpenTelemetry, Jaeger, and Zipkin.
GuideOpenTelemetry — Implementation Guide for Metrics, Logs
A practical guide to OpenTelemetry: instrumentation, collectors, exporters, and wiring OTLP to backends like Jaeger, Prometheus, and Grafana.
GuideStructured Logging: JSON Logs, Correlation IDs, Aggregation
Master structured logging with JSON format, correlation IDs, log levels, and aggregation. Covers Python structlog, Node.js pino, Java SLF4J, ELK and Loki stacks.
GuidePrometheus and Grafana: Metrics, Dashboards, Alerting
Instrument services with Prometheus metrics, query them in PromQL, build Grafana dashboards, and ship alerting rules that don't flap.
GuideSentry: Error Tracking, Triage, and Resolution
Master Sentry for production error tracking. Covers SDK integration in Python, Node.js, and Java, release tracking, source maps, performance monitoring, and alerting.
RecipeReal User Monitoring (RUM) Setup with web-vitals
Monitor actual user experiences with Core Web Vitals, session replay, and performance analytics to identify real-world bottlenecks.